Global Innovation Index (GII): A barometer of innovation capacity across major world economies
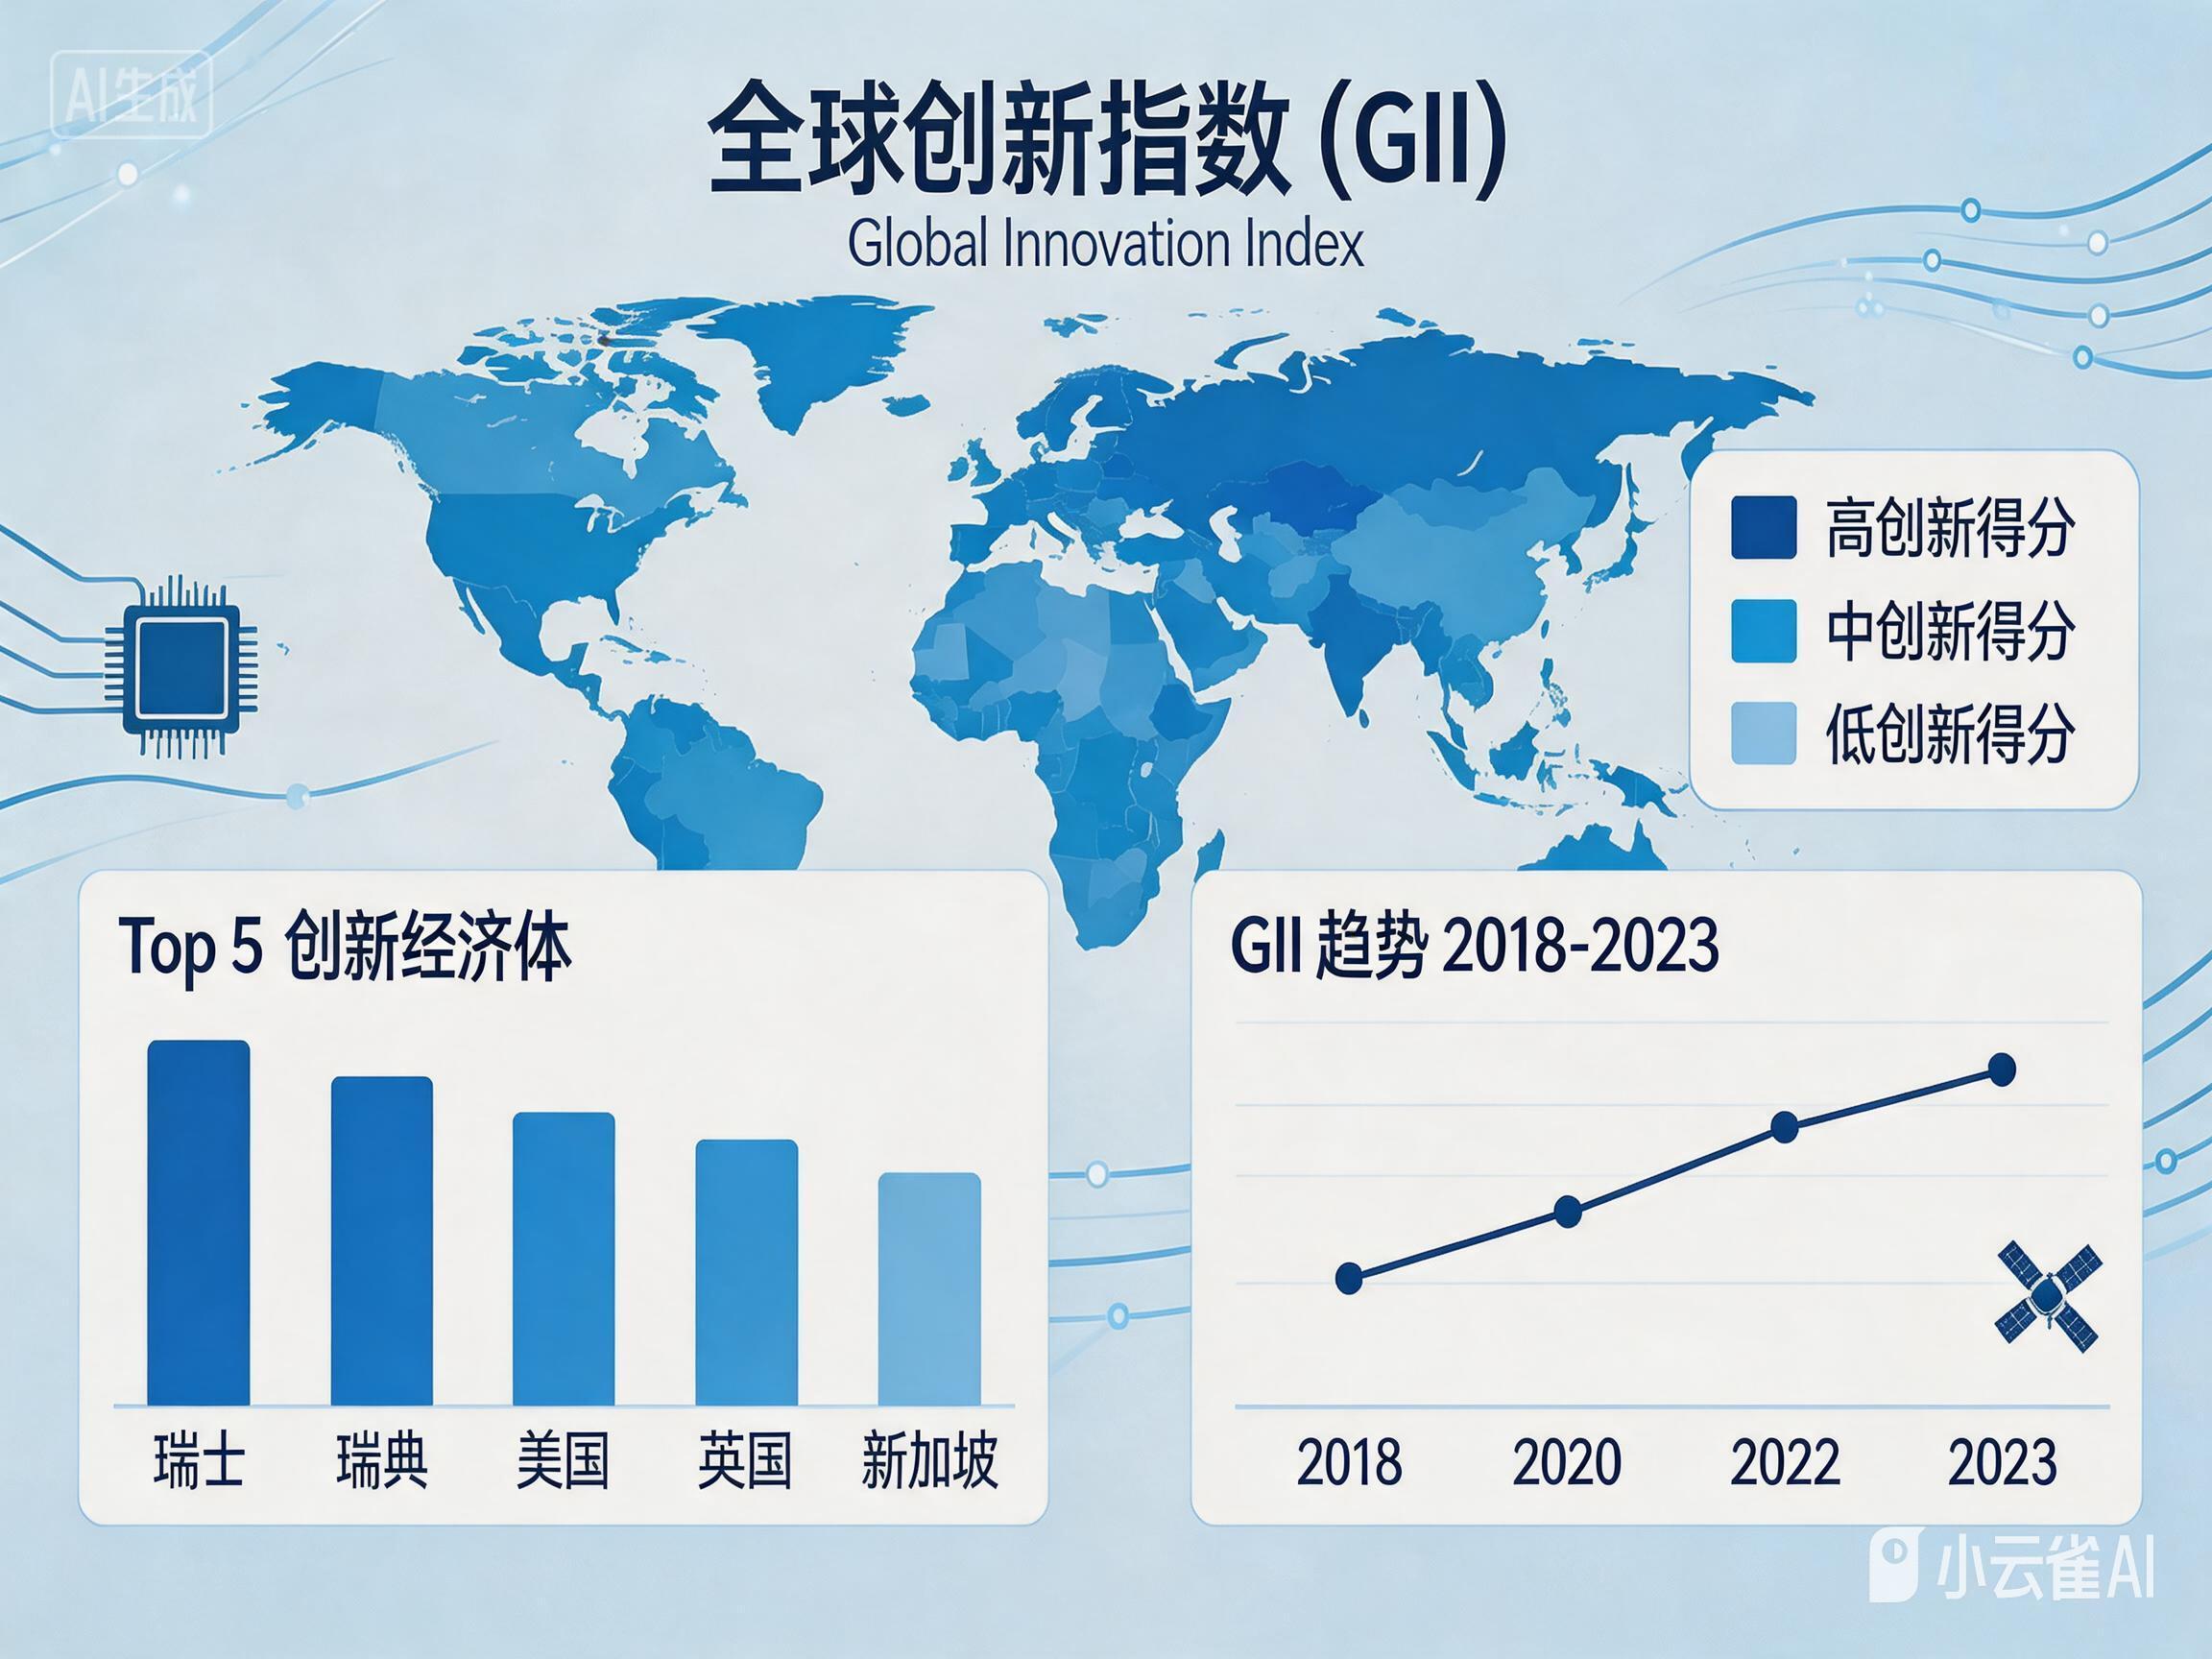
Global Innovation Index (GIIa barometer for measuring the innovation capabilities of major global economies
2007 year,World Intellectual Property Organization (WIPO)Jointly launched with Cornell University and INSEAD, the Global Innovation Index (GII) is now being published.Global Innovation IndexAbbreviationGII), to measure the innovation capabilities of major global economies. As an authoritative comprehensive index publisher, it releases one edition annually as of2025Published this year19period. From the initial coverage126 economy, to2025Annual Coverage139economies.2024 yearWIPOSurveys show that77% member states ofGIIEstablishing a national innovation strategy has driven significantly higher adoption rates in Africa, Latin America, and the Arab region. This metric provides a quantifiable, comparable benchmark for evaluating and guiding decisions within the global innovation ecosystem.
1.2025 Core Product Metrics
From2007First released in the yearGIIProceedInnovation Investment + Innovation OutputTwo dimensions. In nearly20In the course of development, from the initial8Consolidate large modules into the current ones.7 Large Module,21 Sub-module,78 A three-tier system for item sub-indicators, where the input and output sub-indices carry equal weight, and the total score is the average of both.
(1) Innovation Investment Sub-Index Includes5 Large modules represent the foundational conditions that drive innovation.
- Policy: including regulatory environment, business facilitation, intellectual property protection, and political stability to assess the capacity for innovation institutional safeguards.
- Human Capital and Research: Including education investment, R&D personnel density, R&D expenditure intensity, university quality, and industry-university-research collaboration to measure innovation talent and research foundations.
- Infrastructure: Includes information and communication technology, energy, transportation, digital infrastructure, and high-speed rail networks (this indicator is2025 newly added, etc., to evaluate innovation hardware support.
- Market Maturity: Including credit, investment, venture capital, trade openness, and market size to measure innovation capital and the business environment.
- Commercial Maturity: Including corporate R&D investment, knowledge absorption capacity, industry-university-research collaboration, innovation clusters, and knowledge-intensive employment to measure corporate innovation vitality.
(II) The Innovation Output Sub-Index comprises two major modules, representing the tangible results of innovation activities.
- Knowledge and Technical Outputs: Including patent applications, utility models, scientific publications, highly cited papers, exports of technology-intensive products, and value added by high-tech industries to measure innovation outcomes.
- Creative Output: Including trademark registration, industrial design, export of cultural and creative services, digital creative industries, cultural products, etc., to measure outcomes of creative and business model innovation.
II. Evaluation Methods
- Data Source: AdoptWIPO, World Bank, Organisation for Economic Co-operation and Development (OECD) (OECDpublic data from authoritative institutions such as the United Nations, Thomson Reuters, and Times Higher Education.
- Standardize: From initial simple weighting to the current state where all metrics are...Min-MaxStandardize to 0-100 Points, to eliminate measurement discrepancies.
- Weight & Summary: From Submodule→Module→Sub-index→The total score is calculated as a weighted average at each hierarchical level, with the input and output sub-indices each contributing 50%. 50% Weight.
- Quality ControlIndependently audited by the European Commission's Joint Research Centre to ensure methodological transparency and result reproducibility, with no arbitrary imputation of missing values.
- Group Comparison: by World Bank income group (high / Medium-High / Low to medium / low-income) for benchmarking against similar economies.
3.2025 YearGIITop 10 Countries
Rank |
Country / Region
|
Compare 2024 Year-over-Year Change
|
Key Highlights |
1
|
瑞士 |
0
|
连续 15 年位居榜首,在制度、基础设施、知识产出维度全面领先
|
2
|
瑞典 |
0
|
人力资本、研发投入、创意产出方面表现突出 |
3
|
美国 |
0
|
市场成熟度、商业成熟度、风险资本方面位列全球第一 |
4
|
韩国 |
↑1
|
由企业主导研发,在半导体、显示技术领域壁垒深厚 |
5
|
新加坡 |
↓1
|
在制度环境、基础设施、全球创新枢纽方面地位稳固 |
6
|
英国 |
↓1
|
在高校科研、创意产业、国际合作方面优势明显 |
7
|
芬兰 |
0
|
在教育、信息通信技术、绿色创新方面领先 |
8
|
荷兰 |
0
|
农业科技、高端制造、知识密集型产业发达 |
9
|
丹麦 |
↑1
|
在绿色创新、中小企业创新、产学研协同方面优势明显 |
10
|
China
|
↑1
|
首次跻身前十,中高收入经济体第一,创新集群数量全球第一 |
Data source:WIPO《2025 Global Innovation Index Report
IV.2025 YearGIIResult Interpretation
(1) Overall Landscape: Europe and the U.S. Lead, Asia Rises
- Europe remains a hub of innovation.: Europe accounts for 4 of the top 10 6 Switzerland, Sweden, UK, Finland, Netherlands, and Denmark have well-established systems, stable R&D investment, and mature innovation ecosystems, maintaining long-term advantages.
- Asian strength has increased significantly: South Korea (No. 4), Singapore (No. 5), China (the 10) Enter the top ten,Southeast Asia - East Asia - OceaniaYes 6 an economy ranks among the top 25, becoming the second global hub for innovation.
- The United States remains in the top tier.: Driven by capital, ecosystem synergy, and a top-tier cluster “Hardcore Technology”(AIAdvantages in chips, aerospace, and other key areas to maintain a core global innovation position.
(II) China Enters Top 10 for the First Time: A Milestone Breakthrough
- Key Achievements: From 2012 Year 34 leap to 2025 Year 10 bit, is the former 25 Namethe only non-high-income economyRanked first among upper-middle-income economies.
- Core Competencies:
- Innovation Clusters: Owned 24 Shenzhen, a top 100 global innovation cluster ranked first worldwide for three consecutive years. - Hong Kong - Guangzhou cluster surpasses Tokyo - Yokohama ranks first globally.
- Output indicators: number of patent applications, high-tech exports5GGlobal leader in networks, renewable energy capacity, electric vehicles, and battery industries.
- R&D investment: Enterprise R&D expenditure as a share of total social R&D expenditure 75% Above, the intensity of R&D investment continues to rise.
- Areas for ImprovementGaps remain compared to Europe and the U.S. in metrics such as basic research investment, density of high-end talent, efficiency of intellectual property commercialization, and global innovation influence.
(III) Comparison of Typical National Innovation Models
- Swiss Balanced Innovation: Delivers superior input-output performance with no weaknesses in systems, infrastructure, or knowledge creation—ideal for a small yet high-end innovation ecosystem.
- U.S. Capital-Ecosystem InnovationTop-tier market and business maturity, active venture capital, and universities+Enterprise+Efficient capital loops drive breakthroughs in cutting-edge technologies.
- Enterprise-Intensive Innovation in South Korea: Samsung,LGLed by a consortium, with globally leading R&D investment intensity, focusing on hard tech such as semiconductors and displays to build technical barriers.
- Government-Enabled Innovation in SingaporeWorld-class systems and infrastructure to build a global innovation hub, attracting top talent and capital worldwide with a focus on services and digital innovation.
(IV) Global Innovation Trend Signals
- Slowing growth in innovation investment: Sluggish growth in global R&D investment is raising concerns about the future of innovation.
- Clustering and RegionalizationInnovation resources are concentrating in leading clusters, with China, the United States, and Europe serving as core engines.
- Rise of Middle-Income Economies: China, India, Turkey, Vietnam, and others continue to climb the rankings, reshaping the global innovation landscape from... “Western-led” Towards “Multipolar Symbiosis” Transform.
From2007From the inception of the annual target to2025 years, after20Annual development,GIIFrom8The massive pillar rough framework evolves into7The flagship Precision Framework sets the global standard for innovation policy with cutting-edge metrics, rigorous methodologies, and comprehensive coverage.